
Originally Published: August 17, 2021
Last Updated: March 11, 2025
Profits keep shareholders and stakeholders happy and provide your company with more capital to grow. As a fundamental measure of financial performance, profitability provides a gauge of a company’s return on investment and informs strategic decision-making. To plan an effective course of profit-growing actions that are rooted in data, a profitability analysis matters…a lot.
What is Profitability Analysis?
A profitability analysis looks beyond financial statements and end net profit for more detailed insights into an organization’s ability to generate income, including:
- Gross & net profits
- Return ratios
- Margin ratios (profit margin ration, return on invetment)
- Returns of assets, capital employed, and equity
Looking at these in more detail will help maximize profit further by identifying specific areas—like revenue streams, operational costs, or product mix—that can be improved. Your profit analysis will help identify expansion opportunities, market trends, and break-even points, giving decision-makers the information they need to decide on the company’s direction.
The intent of this blog post is to discuss the profitability analysis definition and, more specifically, the details of a customer profitability analysis which is different from a product line profitability analysis. The customer version looks at the various activities and direct costs incurred in servicing a particular customer rather than profit per product. It also provides you with a segmented view of your customers’ profit contribution to your organization.
Why Is Profitability Analysis Important?
With a profitability analysis, you’ll gain a window into how the net profit is broken down across revenue streams, variable costs, and overhead costs. Various factors contribute to the net profit figure and understanding these factors provides insights into how certain aspects of the company are performing. This clarity supports strategic decisions, such as optimizing pricing or reallocating resources to high-potential profit areas.
Types of Profitability Analysis
Profitability analysis adapts to answer specific questions about where, how, and why a business generates profit. Below are three core approaches used to dissect financial performance and guide strategic decisions.
1. Business Profitability Analysis
This holistic approach evaluates a company’s financial health by analyzing financial statements (like income statements and cash flow statements) to assess overall performance. Key metrics include ROI, ROE, and operating profit margin, which reveal how effectively a business converts revenue streams into profit after accounting for operational costs and capital assets.
For example, a retail company might discover that while its electronics division generates the highest revenue streams, its operating costs erode profit margin ratios compared to home goods. This insight could prompt reallocating resources to high-margin product lines.
2. Sales Profitability Analysis
Focused on product mix and pricing efficiency, this method breaks down profitability by individual products, services, or sales channels. It factors in direct costs (e.g., production costs) and indirect costs (e.g., marketing) to calculate cost per unit and break-even points.
A SaaS company, for instance, might use this analysis to compare variable costs across subscription tiers. If premium plans have a break-even point 20% lower than basic plans due to scale, the business could prioritize upselling.
3. Customer Profitability Analysis
A customer profitability analysis identifies which customers drive the most value by comparing revenue against the direct costs (e.g., support) and indirect costs (e.g., onboarding) of servicing them. Metrics like customer lifetime value (CLV) and CAC payback period highlight whether high-maintenance accounts dilute potential profit.
Uber, for example, uses this analysis to adjust pricing in low-margin markets and reallocate marketing spend to regions with higher ROI.
By tailoring these methods, businesses can pinpoint inefficiencies, optimize financial planning, and align strategic decisions with data—whether that’s refining a product mix or rebalancing customer portfolios.
How to Conduct a Profitability Ratio Analysis
A profitability ratio analysis prepares analysts and potential investors for how well the company is performing – making a profit from revenue while considering overheads, balance sheets, shareholders’ equity, and so on. This helps to give potential investors an overall picture of how well the business is performing compared to its competitors and gives a strong understanding of the company’s underlying finances.
More specifically, profitability ratios measure and evaluate your organization’s ability to generate income (profit) relative to revenue and costs over a specific period of time. A profitability ratio analysis helps demonstrate how well a company utilizes its assets to produce profit and value for shareholders. The higher the ratio, the more profitable a company is and the more attractive it becomes to potential investors.

Profitability Ratio Analysis Metrics
A profitability ratio analysis will include a look at these metrics:
Margin Ratios
Margin ratios tell how effective a company is at turning revenue streams into profit. This figure lets potential investors know how well a company has performed during a specific period. Margin ratios can be broken down further, including:
- Cash flow margin
- EBITDA (earnings before interest, taxes, depreciation, and amortization)
- Gross profit margin
- Net profit margin
- NOPAT (net operating profit after tax)
- Operating expense ratio
- Operating profit margin
- Overhead ratio
Gross Profit Margin
Gross profit is the value of all the money made from selling products, then subtracting the costs of making those products. This includes costs like office and admin costs as well as materials and transportation, etc.
The gross profit margin is the gross profit figure divided by the total revenue made from selling their products and multiplied by 100. This percentage is the ratio of profit you are making from your sales.
Of course, continuously high gross profits make you more money. The gross profit margin is also important to incorporate into your financial analysis. If your profit margin is less than around 10% this is a warning sign that you should perform cost-cutting and process improvement measures to boost efficiency.
Net Profit Margin
Your net profit is perhaps the most important of all profitability metrics.
Simply put, it means how much money you have left after all expenditures including taxes, interest, and operational expenses.
The net profit margin is calculated in a similar way to the gross profit margin. Net profit divided by the total revenue, then multiplied by 100 is the percentage that depicts how much of the money you keep after all costs.
The metric helps to identify weaknesses in the business that inform better business decisions to help improve overall profits.
Return Ratios
The return ratio tells how well a company can make returns for its shareholders. Return ratios can be broken down into further categories, including:
- Cash return on assets
- Return on assets
- Return on debt
- Return on equity
- Return on retained earnings
- Return in invested capital
- Return on revenue
- Risk-adjusted return
- Return on capital employed
Return on Assets and Returns on Capital Employed
These profitability metrics tell a company how effectively they are using the resources at their disposal. Return on Assets (ROA) is how much revenue a company has made against the value of the assets owned by the company.
Returns on Capital Employed (ROCE) show how much revenue a company is making against how much money is being used to operate the business. The higher the ratio, the more efficiently a company is operating. A low ratio means the company needs to look into improving efficiency to keep the business healthy.
Return on Equity
The Return on Equity metric illustrates how much shareholders expect their return to be on their investment. Thus, the goal is to keep this figure high and encourage further investments.
Behind every net profit figure is a wealth of metrics that will inform better insights and decision making. A profitability analysis provides the details necessary to fully understand an organization’s ability to generate income. It provides how well a company is performing ‘under the hood’ and it helps to identify where the company is doing well, and where gaps exist. Once problem areas have been identified, senior management then makes decisions regarding business operations to help keep the company healthy.
The analysis is also important for potential shareholders who will be looking for healthy businesses to invest in. A robust profitability analysis encourages further investment, helps to improve capital, and keeps the business performing at a high level.
Critical for Success
Profitability ratios are the financial compass every modern business needs to navigate today’s competitive markets. These metrics cut through the noise to reveal how efficiently a company converts revenue into profits and resources into shareholder value. For businesses aiming to optimize pricing strategies, manage costs, or secure investor confidence, these ratios are non-negotiable tools, and they matter for a number of reasons:
- Performance benchmarking: Profitability ratios like gross profit margin and ROE let businesses compare their efficiency against competitors or historical performance. For example, companies in the same industry often share similar gross margin benchmarks, and deviations can signal competitive advantages or operational gaps.
- Strategic decision-making: Ratios like operating profit margin expose inefficiencies in cost management or pricing strategies. Businesses using margin analysis can identify areas to streamline operations—such as reducing COGS or optimizing marketing spend—to improve profitability.
- Investor and lender alignment: Return ratios like ROA and ROE directly influence investment decisions, as they reveal how effectively a company uses assets and equity to generate returns. Investors prioritize these metrics to assess long-term viability.
The shift toward “profitable growth” in 2025 further underscores their importance. As Alexander Group notes, businesses must balance scaling revenue with maintaining healthy margins—a task requiring precise analysis of ratios like operating margin and ROA.
Profitability ratios offer actionable insights to make informed decisions. Dynamic pricing tools and CPQ software directly influence margin ratios by eliminating guesswork from quotes, while rebate management systems protect net profits by automating complex agreements. By tracking these metrics, businesses can spot trends, justify strategic pivots, and prove their value to stakeholders.
In short: If you’re not measuring profitability ratios, you’re flying blind in a data-driven economy.
Profitability Management Best Practices for 2025
Effective profitability management hinges on turning data into decisions. Here’s how to streamline your approach:
- Track margin trends weekly: Use profitability reports to monitor gross and net margins by product, customer, or project. For example, Procore notes that real-time updates prevent misallocations (like bulk material costs skewing a project’s budget) and protect margins.
- Automate cost allocation: Assign direct costs (e.g., labor) and indirect costs (e.g., overhead) accurately with software. Automated systems reduce errors in financial reports, ensuring profitability insights reflect true performance.
- Prioritize high-value customers: HubSpot found that a 5% boost in customer retention can increase revenue by up to 95%. Use customer profitability analysis to identify accounts worth upselling or streamlining.
- Benchmark against industry ratios: Compare metrics like operating profit margin and ROI to sector averages. Construction companies, for instance, use job profitability reports to spot if labor costs exceed industry norms.
- Cut waste, not quality: Audit operational costs quarterly. Auditing recurring expenses, renegotiating supplier contracts, or reducing energy waste can lift margins without sacrificing output.
To level up your efforts, integrate profitability dashboards with tools like Vendavo’s CPQ software to align pricing strategies with up-to-date margin data.
Key Takeaways
Consider these key takeaways before conducting your own profitability analysis:
- A customer profitability analysis is different from a product profitability analysis. It looks at the various activities and expenses incurred in servicing a particular customer and provides a segmented view of who is contributing what to your organizational profit.
- A profitability ratio analysis prepares analysts and potential investors for how well the company is performing compared to competitors.
- Profitability ratios measure and evaluate your organization’s ability to generate income (profit) relative to revenue and costs over a specific period of time. Commonly relied upon key profitability metrics include: Gross Profit Margin, Net Profit Margin, Margin Ratios, Return Ratios, Return on Assets, Return on Capital Employed, and Return on Equity.
- Organizations will learn how well they are doing ‘under the hood’ with a profitability analysis and potential shareholders can better understand and therefore invest.
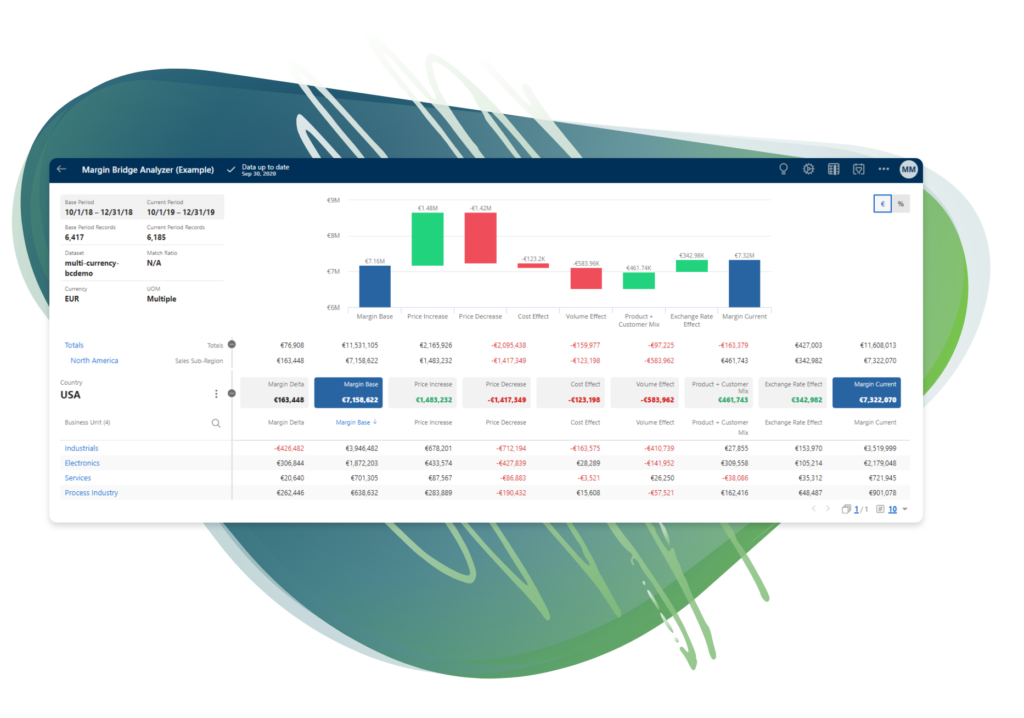
If you’re considering a profitability analysis for your organization, consider doing a Margin Bridge Analysis or diving deeper into your price/volume/mix variance. This is a way to see all your metrics and insights in a single, synthesized report in an easily digestible format. Check out Vendavo Margin Bridge Analyzer.