
Knowing how your prices stack up against competitors’ is a good step to take but how can it be done to scale? What competitive price data should be collected and how do you analyze and visualize the information for maximum insights? Follow these best practices from Dan Cakora, Business Consultant at Vendavo.
Recently I spoke with a long-time customer of Vendavo who wanted advice on how to collect, analyze, and visualize competitive price data over time. Capturing competitive pricing can be tricky in B2B, so we set out to provide a preview of the possibilities this type of data collection could offer.
Are you considering analyzing your competitors’ price data? Here’s a quick how-to for ensuring you get the most insights from your efforts:
- What is competitive price analysis?
- What data should be collected?
- How do you compute a price difference?
- How to conduct a competitive pricing analysis
- How can you visualize competitive pricing data so you can make smart decisions?
- Importance of competitive price analysis
What Is Competitive Price Analysis?
Competitive price analysis is all about understanding how your competitors price their products and services—and how those choices stack up in the marketplace. It’s not just about comparing numbers; it’s about digging into pricing trends, customer behavior, and market dynamics to make smarter, data-backed decisions.
This type of analysis goes beyond simple side-by-side comparisons. It involves looking at the big picture: direct and indirect competitors, product availability, promotional strategies, and even seasonal trends that influence buying decisions. Done right, it gives businesses the insights needed to refine pricing strategies and stay ahead of the competition.
Key elements of a strong competitive price analysis include:
- Data collection: Tracking details like competitor pricing, promotions, and inventory levels.
- Market position monitoring: Understanding how pricing shifts influence customer behavior and overall market trends.
- Strategic evaluation: Using the data to uncover patterns, opportunities, and potential competitive advantages.
For B2B companies, competitive price analysis is a powerful tool for boosting profit margins and finding untapped market opportunities. It helps maintain a competitive edge without falling into the trap of price wars, which can chip away at long-term profitability.
What Competitive Price Data Should You Collect?
Consider starting with capturing the following data fields:
- Date &Time – Identify moments in time so you can see trends develop as your data set grows
- Competitor Name & ID – This is especially important if data is being collected from multiple sources
- SKU & Product ID – This could include either the Manufacturer Part Number (common for distributors) or the competitor part number that corresponds with your part number (common for manufacturers)
- Competitor Price – Most times this will be the list price rather than a net price
- Unit of Measure – Many industries need to calculate a common UOM to make valid comparisons
- Inventory Level – Optional field that can be useful when comparing product availability
- Freight – Note this may be bundled in the price or split out as a separate line item
Do not consider this an exhaustive list. Attempt to collect as much data as you can, assuming the cost is not astronomical.
How to Compute Price Differences
Now that you know what data needs to be collected, you need to define how you will compare your price to the competitor price. Nominal price differences are easy to compare.
Here’s an example:
If your price is $100 and your competitor’s price is $90, then the nominal price difference is $100 – $90 = $10. This is helpful on an individual SKU level, but it becomes difficult to maintain when aggregating multiple SKUs.
When it comes to computing the relative price difference for a group of products, use this equation:
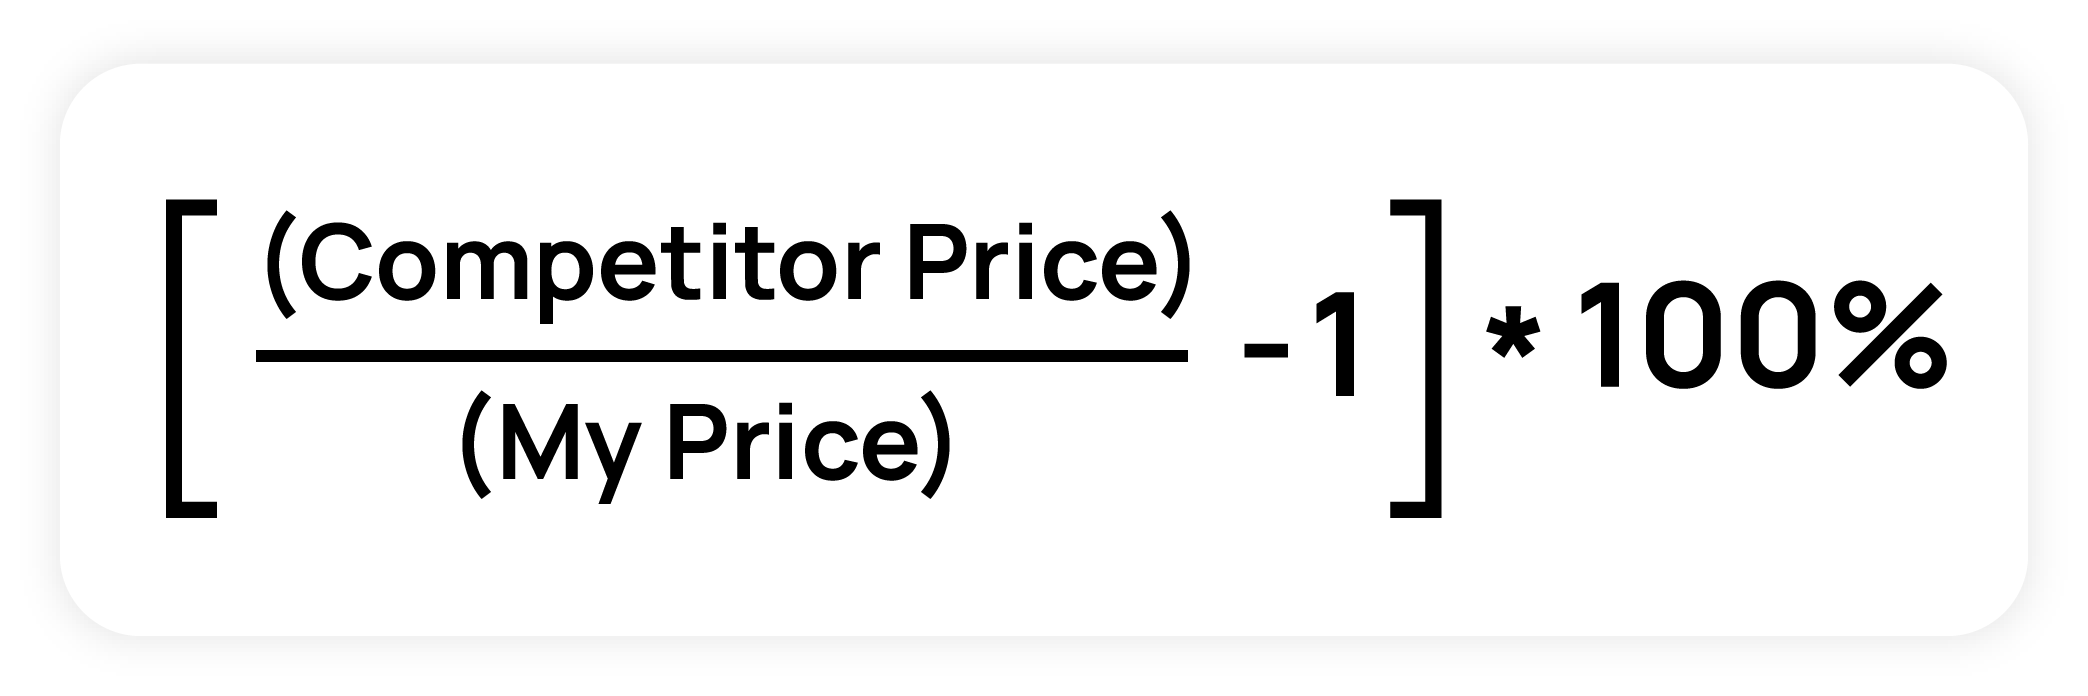
For this SKU, if the competition is priced at $90 and you’re priced at $100, then the competition is 10% below your price. If a second competitor for that same SKU is priced at $105 and you’re still at that same $100, then that competitor is priced 5% above you. Calculating the price differential this way will make interpreting charts easier, which we will get to soon.
How to Conduct a Competitive Pricing Analysis
A competitive pricing analysis helps businesses understand where they stand in the market and how to refine their pricing strategies. To get it right, you need a clear plan that blends research, data, and ongoing adjustments. Here’s how to break it down:
Step 1: Identify and Classify Competitors
Start by mapping out the competition through detailed market research. Divide them into three groups:
- Primary competitors: Those offering similar products or services to the same audience. Look at their market share and reach.
- Secondary competitors: Businesses with higher- or lower-tier versions of your offerings.
- Tertiary competitors: Companies targeting the same customers with related but different products or services.
For each competitor, note their strengths, weaknesses, and position in the market.
Step 2: Assess Value Propositions
Understanding competitor pricing requires looking beyond the numbers to what customers perceive as valuable. Analyze these areas:
- Product quality: Compare features, performance, and longevity.
- Brand positioning: Evaluate customer loyalty and brand reputation.
- Customer experience: Review pre-sale, implementation, and post-sale support, including warranties and service agreements that might justify premium prices.
Step 3: Collect and Analyze Pricing Data
Build a solid data collection framework that covers:
- Current Prices: Across product lines and features.
- Historical Trends: Patterns over time, seasonal fluctuations, and market responses.
- Promotions: Discount schedules, bundles, and special offers.
- Geographic Adjustments: Regional price differences and localized strategies.
Step 4: Put Insights Into Action
Once you’ve gathered the data, use it to create strategies that align with your business goals. Focus on:
- Pricing corridors: Establishing a range that balances competitiveness and profitability.
- Value communication: Explaining your pricing to customers in a way that highlights your strengths.
- Competitive responses: Setting protocols for reacting to price changes without risking long-term profitability.
Technology is your ally here. Use analytics tools to process data quickly and uncover trends, as well as visualization platforms to make the findings easy to understand. Ensure pricing insights flow seamlessly into your decision-making processes for faster and smarter reactions to market shifts.
Step 5: Keep Reviewing and Adjusting
Competitive pricing isn’t a one-and-done task. Schedule regular check-ins:
- Monthly reviews: Evaluate how your prices compare to competitors and track any shifts.
- Quarterly updates: Measure the success of your pricing strategy and its impact on market share.
- Annual planning: Dive deep into long-term trends to adjust for future market changes.
By staying proactive and flexible, you’ll keep your pricing strategy sharp and your competitive edge intact.
Competitive Price Data Visualization Models
After you’ve collected and analyzed competitor pricing data, you can visualize this data to better understand how competitor prices change over time. Here are five visualization models to leverage in your toolkit.
1. Price Leader
The chart below indicates your price change (indicated by the blue line going up) that results in your competitor mirroring your price with a change of their own. Critically, they make sure to never exceed your price (indicated by the red shaded area).
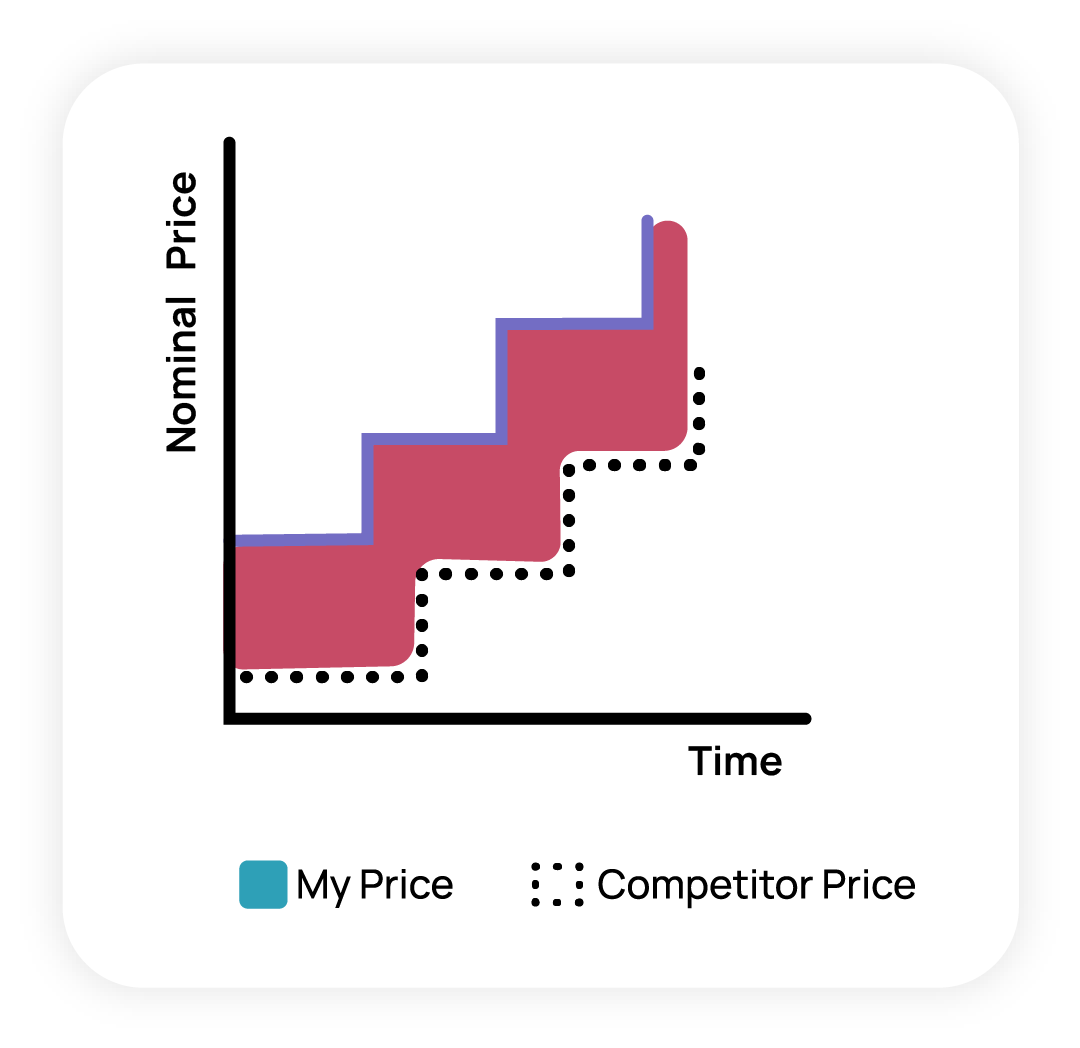
If you see this trend, then you know that you are a price leader, and your competitor is a price follower. If you are okay with this arrangement, then continue to push price and monitor your competition to see that they follow suit. If this arrangement is not agreeable, then periodically (and temporarily) drop your price. The competitor may follow suit right away, or they might hold their pricing as the new pricing equilibrium is reached.
2. Steady Price
On this chart, you held your price constant over time, while your competitor made periodic price increases, going from lower price to higher price. Is this a good or bad thing? It depends, of course.
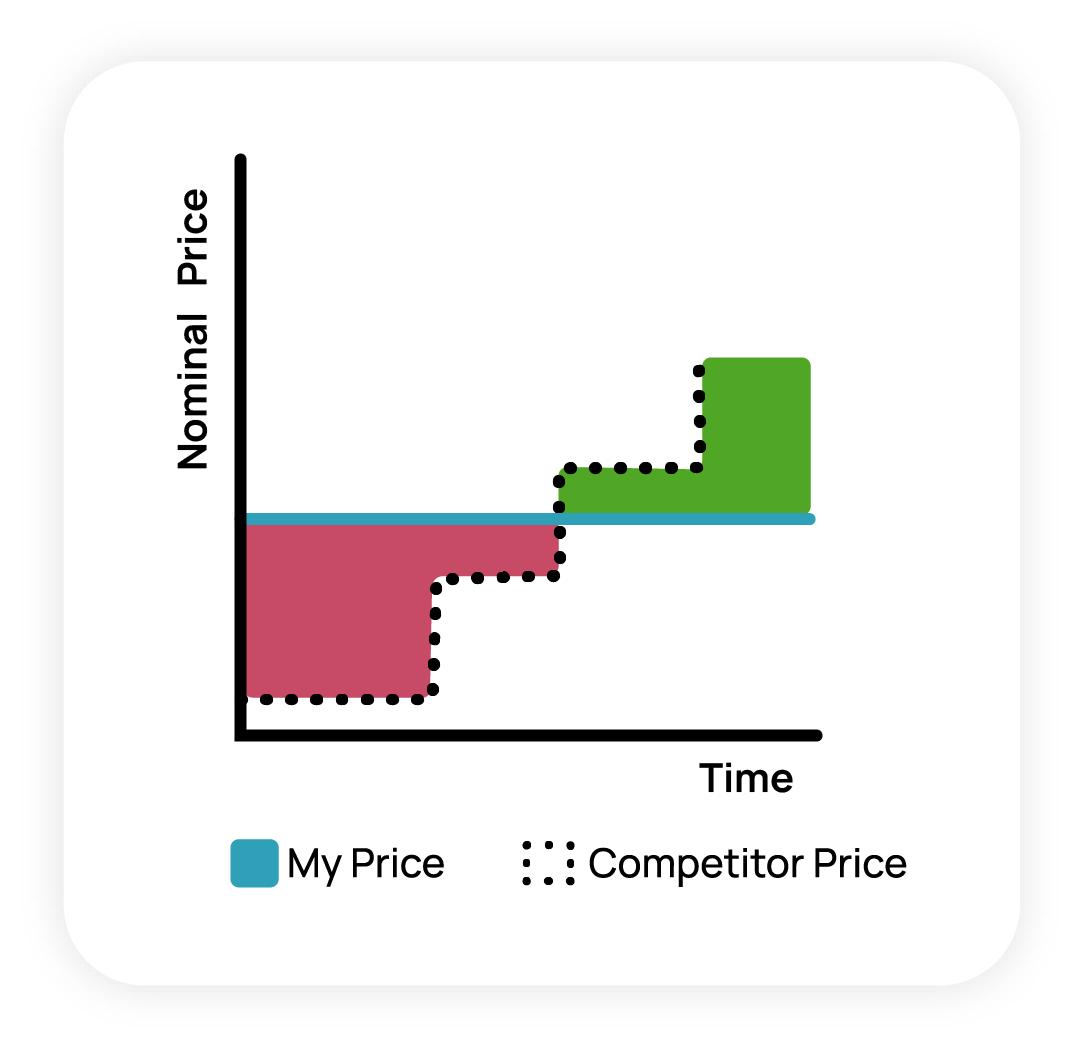
Here’s what it depends on:
- If your product or service offers a premium value but does not collect a premium price, then you’re leaving money on the table.
- Perhaps you’ve been more diligent in managing your cost structure and can afford to keep prices flat. If so, then strive to grow volume (and therefore revenue) due to your advantage.
- Maybe this trend is a result of an evolving market. Has the competition introduced new services that support their product and can command a higher price? Have they introduced a new generation of a product? There could be many explanations, and this chart should be the trigger for investigating the root cause of the trend.
*Important Note: For the next three charts, the y-axis is now the % price difference rather than the nominal price difference.
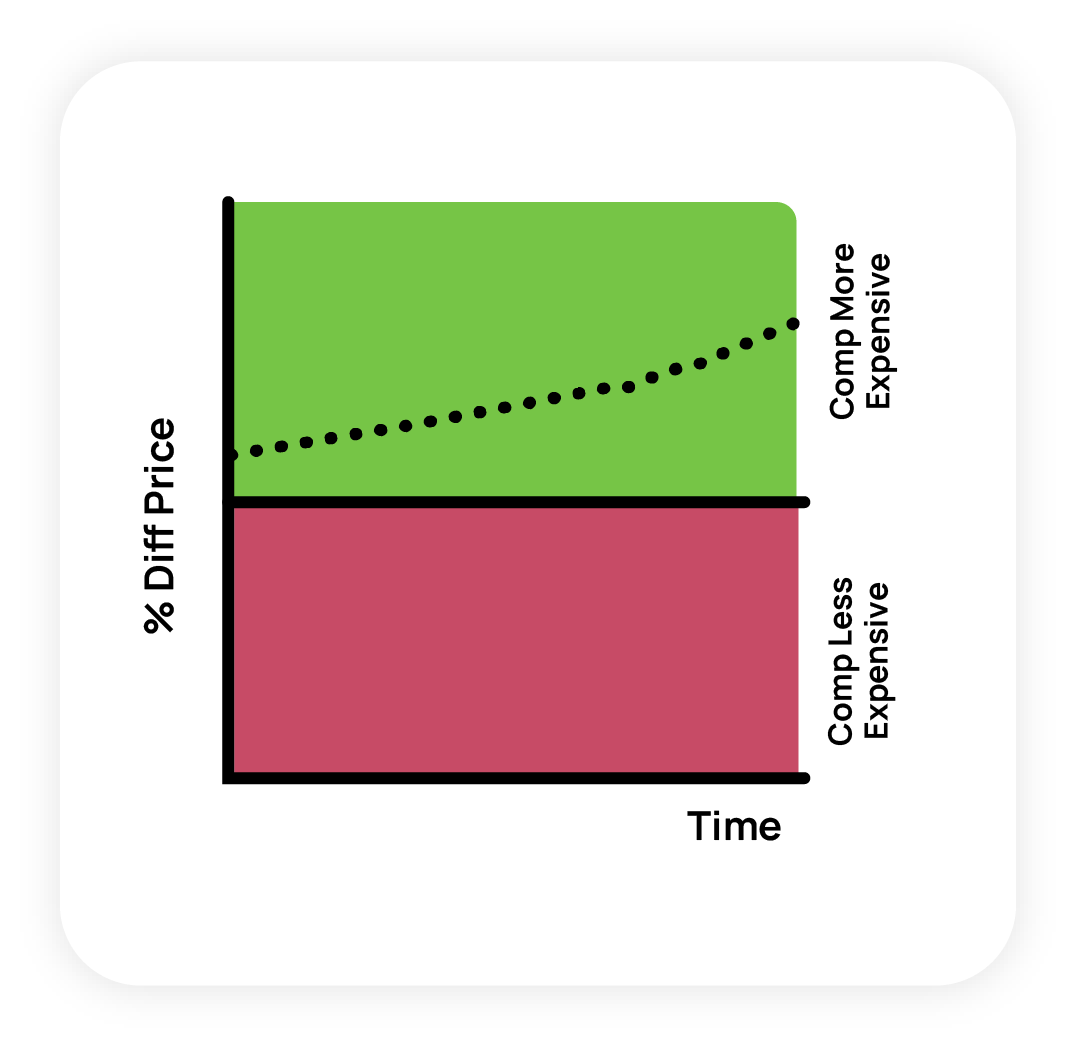
3. Widening Price Gaps
In this example, you and your competitor used to be priced close to parity, but the gap between the two is widening over time. Usually, it is a good idea to charge a premium where your value proposition can support it but remain vigilant so that the gap does not become too large.
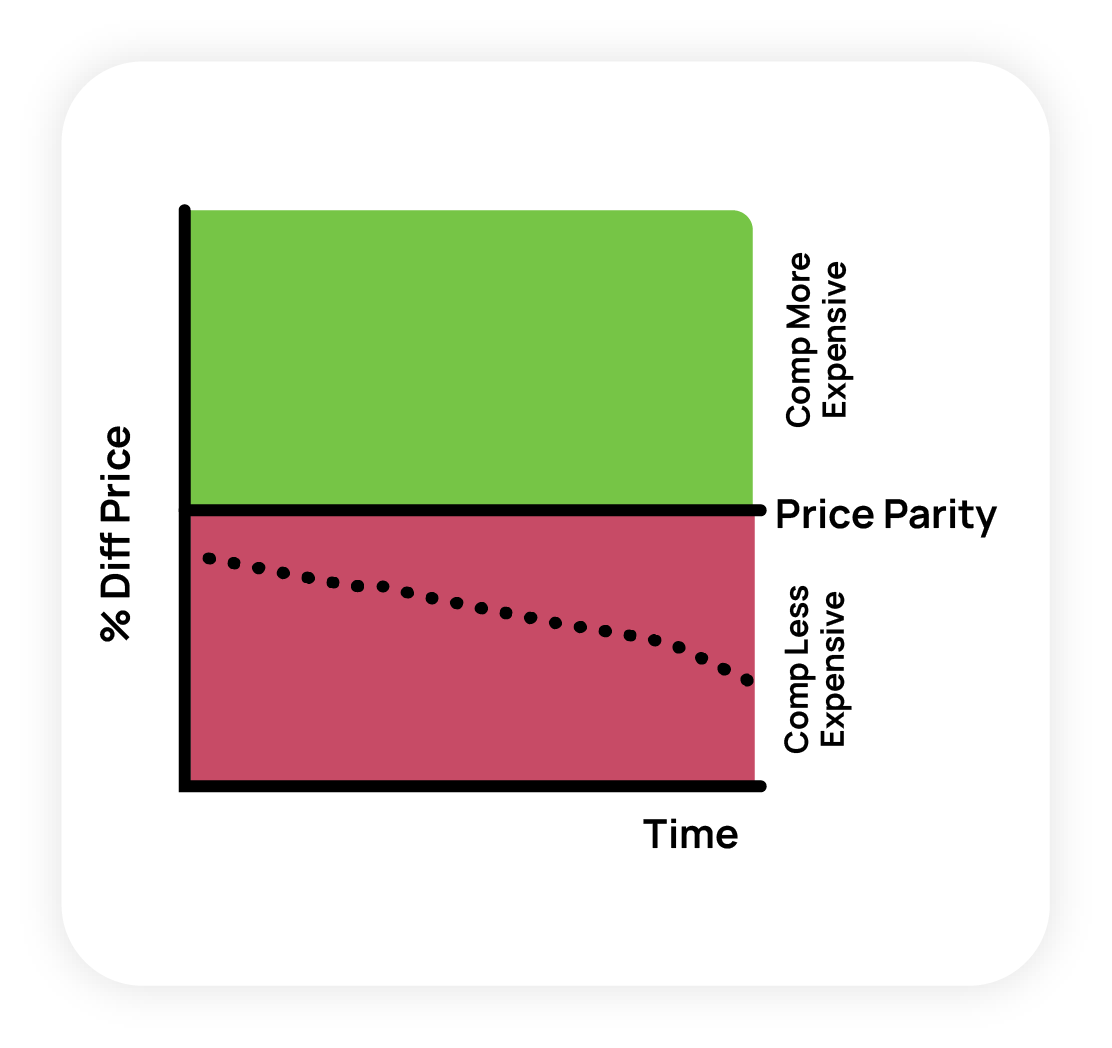
4. Underpriced
This example is the inverse of the chart above. You have always been less expensive than your competitor, and that gap is growing over time. This is probably evidence that you are becoming underpriced and you are leaving money on the table. Strongly consider a price increase to close the gap, assuming there have not been vast structural changes that could explain the decoupling.
5. Fluctuating Prices
Charts like this are often found in industries where seasonality or promos are common. The wild fluctuations in relative price are usually a response to market repositioning. Companies decide they want to own a “power window” (for example, selling TVs in the lead up to the Super Bowl) and heavily promote their prices to make sure they are the lowest cost provider during that time. The rest of the year they are happy to charge a premium when customers aren’t as price sensitive.
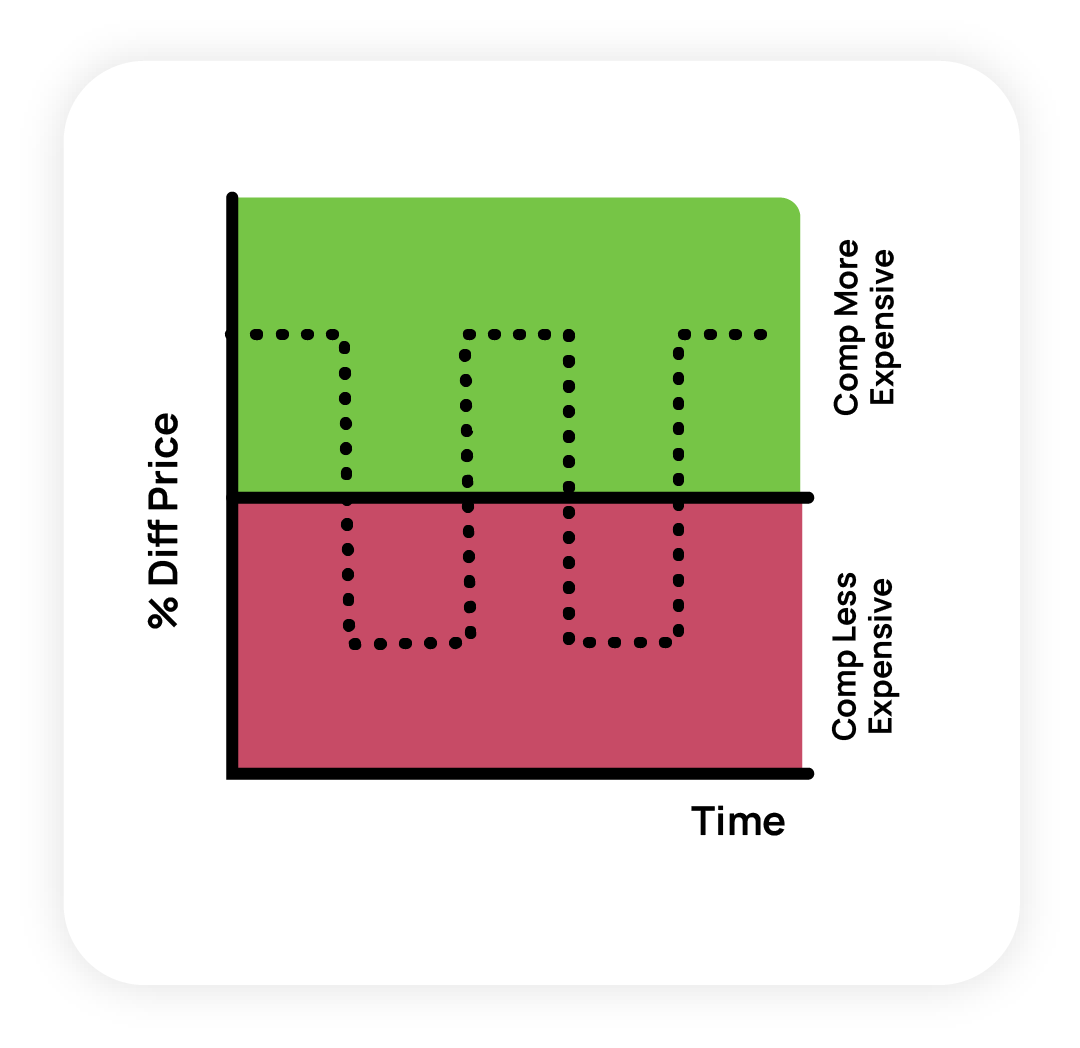
Best practice is not to engage in a destructive price war with a competitor determined to lower prices. Find other times to dominate or compete on value rather than price.
Importance of Competitive Price Analysis
Competitive price analysis is vital in modern business strategy, particularly in the dynamic marketplace. Organizations that implement robust price analysis processes gain significant advantages in market positioning and financial performance.
Strategic pricing decisions directly impact a company’s bottom line and market share. Research from Harvard shows that even a 1% improvement in price optimization can lead to an average profit increase of 11.1% for businesses. Effective competitive price analysis helps organizations identify these crucial optimization opportunities.
Price analysis serves as a critical tool for:
- Market intelligence: Understanding competitor pricing strategies, market trends, and customer price sensitivity across different segments.
- Revenue optimization: Identifying opportunities to adjust prices without sacrificing market share or customer relationships.
- Risk management: Detecting and responding to competitive threats before they impact business performance.
- Strategic planning: Developing a data-driven pricing strategy that aligns with long-term business objectives.
- Customer segmentation: Understanding price sensitivity and value perception across different market segments.
- Value positioning: Ensuring prices reflect the true value delivered while maintaining competitive advantage.
- Market adaptation: Responding quickly to changing market conditions and competitive pressures.
In today’s data-driven business environment, competitive price analysis has become increasingly sophisticated. Advanced analytics and artificial intelligence enable companies to process vast amounts of pricing data and identify patterns that would be impossible to detect manually. This technological evolution has transformed price analysis from a periodic exercise into a continuous, real-time strategic function.
The impact of effective price analysis extends beyond immediate pricing decisions. It provides valuable insights into market dynamics, customer behavior, and competitive positioning. These insights help organizations develop more resilient pricing strategies that can adapt to changing market conditions while maintaining profitability.
Empower Your Pricing Strategies
Deciding how to price your products or services is a difficult task. While understanding and analyzing your competitors’ pricing is critically important, it’s also but one element to consider in your strategic decision making.
Your customers’ changing willingness to pay and evolving market dynamics must also be considered when setting price. You can boost your pricing agility and stay ahead of changing markets with Vendavo Pricepoint.
To learn more about common pricing models, read A Quick Guide to Pricing Strategy.