
Originally Posted: August 2, 2021
Last Updated: March 31, 2023
Paul Sansom, Business Consultant at Vendavo illustrates how you can conduct a margin impact analysis to get critical insights into what’s driving increases or decreases in your profits.
In today’s age, business analysis can best be described as an infuriating struggle that often ends in analysis paralysis. There are a number of micro and macro impacts that can, and often do, correlate with your business’ performance. Analysts are frequently stumped when attempting to separate what matters from what doesn’t. These exercises are searching for one, very elusive thing: causality.
Which brings us to an unfortunate truth in business today: we typically know what happened, but we rarely know why.
How do we better understand the impact on our margins? Margins can often be made up of revenue streams from various sources and determined by a handful of different factors.
Consequently, it can be all but impossible to know at a glance exactly what’s driving increases or decreases in your profits. This is where a margin impact analysis, also called margin bridge analysis, comes in.
What is a Margin Analysis?
In simple terms, a margin analysis is a critical process used to evaluate an organization’s profitability at various levels. More specifically, it’s a handy financial tool that examines the relationship between revenue and costs, providing crucial insights into a company’s financial health and operational efficiency.
The analysis typically encompasses multiple levels of profitability, including gross margins, operating margins, net margins, and contribution margins for specific products or services. For publicly traded companies, margin analysis is often performed across different reporting segments, such as business units, verticals, regions, or markets. This segmented approach allows stakeholders to grasp which areas are bringing in the most profit. In some cases, companies may combine these segments to gain a more nuanced view of their financial performance.
How to Calculate Margin Analysis
Calculating a margin analysis involves several steps and different types of margins. Here’s a simple breakdown on how to perform a margin analysis:
1. Calculate Gross Margin
Gross Margin = (Revenue – Cost of Goods Sold) / Revenue × 100
This measures the profitability of a company’s core product or service.
2. Calculate Operating Margin
Operating Margin = Operating Income / Revenue × 100
Operating margin shows how much profit a company makes after paying variable costs but before paying interest or taxes.
3. Calculate Net Margin
Net Margin = Net Income / Revenue × 100
Net margin represents the percentage of revenue that translates into profit after all expenses are deducted.
4. Analyze Trends and Benchmark Against Industry
Compare these margins over time (e.g., year-over-year or quarter-over-quarter) to identify trends in profitability as well as industry averages or competitors to gauge relative performance.
5. Perform Segment Analysis
Calculate margins for different product lines, geographical regions, or customer segments to identify areas of strength and weakness.
6. Conduct PVM Analysis
A Price-Volume-Mix analysis involves breaking down changes in gross profit into the effects of price changes, volume changes, and product mix shifts.
7. Create a Margin Bridge
Visualize how different factors contribute to changes in margins from one period to another using a waterfall chart.
To perform these calculations effectively, use financial software like Margin Bridge Analyzer or spreadsheet tools that can handle large datasets and complex formulas. Remember that margin analysis is not just about the numbers – it’s about understanding the story behind those numbers and using that insight to make informed business decisions.
Conducting this analysis also requires an understanding of various margin analysis types, which we’ll expand on below.
Uses and Benefits of Margin Analysis
Conducting a margin analysis enables organizations to benefit in various ways, including:
- Performance insight: Provides a clear understanding of where the company generates profits or incurs losses across different segments, products, or markets.
- Informed decision making: Enables management to augment positive factors and mitigate negative ones impacting the bottom line.
- Timely performance improvement: More frequent analysis allows for prompt actions to enhance performance before official reporting dates.
- Strategic pricing: Helps in determining optimal pricing strategies for products or services based on profitability data.
- Cost control: Identifies areas where costs (e.g. operating costs, production costs, cost of sales, etc.) can be reduced without sacrificing quality or output.
- Competitive advantage: Provides insights that can be leveraged to gain an edge over competitors in the market.
- Stakeholder communication: Offers valuable data for reporting to investors, board members, and other stakeholders.
- User focus: Primarily utilized by financial roles in publicly traded companies, with results periodically shared with business units.
With the insights extracted from this exercise, it becomes considerably easier to decide where to focus your time, money, and resources. Here we take a closer look at how to conduct a useful margin analysis.
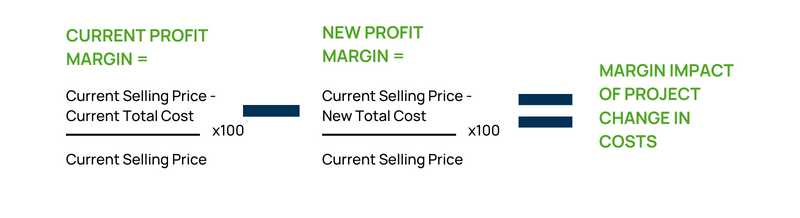
How to Calculate Margin Impact Ratio
Margin impact can be identified by comparing current profit margin to a future state after making a change.
A simplified example could be as follows. If you decide to change price volume mix, here’s how to calculate your margin impact ratio for a cost-based margin impact.
To begin, find your current profit margin. This can be done by subtracting total costs from selling price and dividing by selling price, then multiplying by 100. Next, calculate the new margin by using the same formula with projected costs. Finally, compare the two margins by subtracting the new from the old to determine the impact of cost changes.
Conducting a Margin Impact Analysis: Recognizing and Isolating Variables
Margins are determined by many factors. These range from your prices and products to the location they are sold in. During margin analysis, it’s crucial to isolate each factor – and this is done by keeping the remaining factor the same. For instance, changing the price of the same products sold in the same area lets you identify how much of an impact price and volume has.
Here are the variables you should understand in depth:
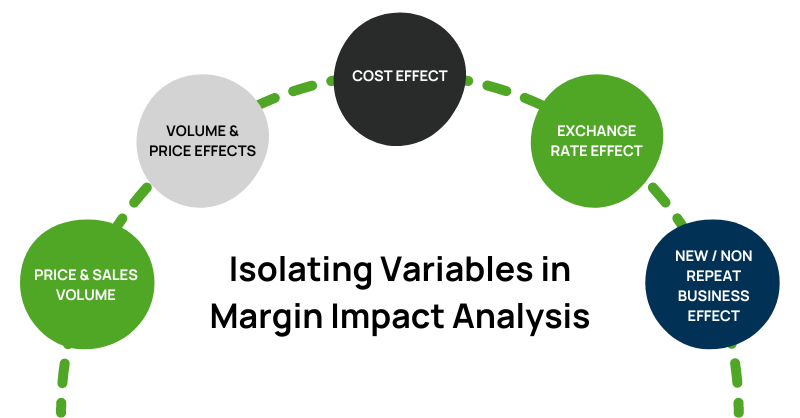
Price & Sales Volume
There is no guarantee that selling a higher volume of product will lead to more profit. Once the cost of goods sold is covered, selling more doesn’t typically lead to an increase in sales dollars left over. Selling more products above cost, however, is one of the most straightforward ways to increase margins. Understanding the impact of this price increase comes down to gross profits; by analyzing gross margins quarter over quarter, it’s easier to see how much additional profit has been earned off the back of a price increase.
Volume & Price Effects
The volume effect represents the effect of revenue/margin change due to changes in volume with an assumption of unchanged prices/margins across the comparison periods. The Price Effect has a similar principle, just flipped around: what are the impacts of price changes on sales volumes and other measures.
Cost Effect
Let’s imagine a scenario where product costs decrease, but “overall” costs have increased, and your aggregated cost effect shows a negative margin impact. What could have caused this? Have variable costs changed? Have sales commissions been adjusted? Are rebates or payment terms or freight costs having a greater negative contribution? With a granular breakdown of your costs, you can pinpoint EXACTLY what, where, and when costs are impacting your bottom line, and do what is necessary to mitigate future issues.
Exchange Rate Effect
International companies that sell across borders should be frequently analyzing the impact of currency fluctuations on sales volume and margin and revenue. This is especially true during times of inflation, stagflation, all the other “-ations”, and strong reserve currencies. But decomposing this effect has historically been a complicated endeavor, to say the least. Being able to assess these impacts, broken into different currencies or groups of currencies (in the same analysis), enables more strategic volume reallocation. Companies can shift volumes to regions to take advantage of those favorable exchange rates and “unlock” new profit centers.
New & Non-Repeat Business Effect
A typical comparison analysis of one time period to another at the customer-product level, will only make sense if there is a purchase for that customer and product in both time periods. This “match” requirement is a gap in that level of analysis, as it will fail to account for both new, lost, and non-repeat business. But putting the focus and accounting for the “unmatched” business will enhance your understanding of and provide actionable insights into your business development, and sales performance, and product/customer behavior, and how they should affect your pricing strategies and sales forecasts.
Types of Margin Analysis
Margin analysis can be conducted in various ways, each providing unique insights into a company’s financial performance. Here are some of the most important types of margin analysis:
- Gross margin analysis: Examines the relationship between revenue and the cost of goods sold (COGS). It helps assess the efficiency of production processes and pricing strategies.
- Operating margin analysis: Focuses on earnings before interest and taxes (EBIT) in relation to sales. This type of analysis provides insights into a company’s operational efficiency and profitability.
- Net margin analysis: Evaluates the overall profitability of a company by comparing net income to total revenue. It offers a comprehensive view of a company’s financial health after accounting for all expenses.
- Contribution margin analysis: Measures the profitability of individual products or services by calculating the difference between sales price and variable costs. This analysis is crucial for product mix decisions and break-even analysis.
- Segment margin analysis: Involves analyzing profitability across different business units, geographical regions, or product lines. This type of analysis helps identify which segments of the business are most profitable.
- Cash flow margin analysis: Examines the relationship between operating cash flow and revenue, providing insights into a company’s ability to generate cash from its operations.
- EBITDA margin analysis: Focuses on earnings before interest, taxes, depreciation, and amortization as a percentage of revenue. This analysis is useful for comparing companies with different capital structures or tax situations.
Of these types, gross margin analysis is the most fundamental calculation as it evaluates the efficiency of production by comparing revenue to the cost of goods sold, helping businesses understand their basic operational profitability. Operating margin analysis goes a step further by assessing earnings before interest and taxes (EBIT) relative to sales, providing insights into overall operational efficiency and cost management. Finally, net margin analysis calculates a company’s profitability by accounting for all expenses, providing clarity into an organization’s true financial health.
What is a Margin Bridge?
A margin bridge, also known as waterfall analysis, is a powerful analytical tool used to compare financial performance across different time periods, typically year-over-year or quarter-over-quarter. This method provides a representation of the many factors that contribute to changes in profitability over time, allowing businesses to identify and quantify the specific elements impacting their financial results.
At the heart of margin bridge analysis is the Price Volume Mix (PVM) analysis, which examines the interplay between price changes, volume fluctuations, and mix effects, including variations in customer and product composition. This analysis establishes causal relationships between pricing strategies, sales volumes, and product or customer mix shifts. For example, a margin bridge could help a company understand the impact of a 10% price increase on overall sales volume and customer mix.
One of the key benefits of a margin bridge is its ability to determine whether pricing strategies effectively compensate for potential losses in sales volumes and changes in customer mix. This analysis helps companies balance the delicate relationship between price and volume, which is often a challenging task. However, it’s important to note that margin bridge analysis is typically performed at a high level for the entire company or specific reporting segments. Due to the diverse nature of pricing and sales strategies across different product lines, markets, or customers, this analysis rarely delivers specific actions at these more granular levels. This detailed analysis supports more informed decision-making and helps companies navigate the complex landscape of pricing, product mix, and market dynamics.
Tools like Vendavo’s Margin Bridge Analyzer are valuable for conducting detailed margin analysis across multiple business dimensions. This solution provides comprehensive price-volume-mix PVM analyses through intuitive, configurable interfaces that allow users to build custom revenue and margin bridges. By automating complex calculations and providing easy-to-consume insights, organizations can quickly analyze, simulate, and explain revenue and margin changes, supporting more informed decision-making around pricing strategies and profitability drivers
Volume / Mix Analysis
There is no guarantee that selling higher volumes will lead to more profit. But understanding the relationship between Price and Volume is key to drawing the right conclusions about the performance of your pricing and sales strategies. Again, the volume effect represents the effect of revenue/margin change due to changes in volume with an assumption of unchanged prices/margins across the comparison periods. The goal of Volume / “Mix” analysis is to separate the impact of the Volume Effect and the impact of relative contribution aggregated to relevant business hierarchies, known as the “Mix” Effect. These business hierarchies include the Product Mix, Sales Channel Mix, Customer Mix, and any other relevant dimension that exists in your dataset.
For example, an unplanned purchase of a large quantity of product from a customer would typically contribute positively to the volume effect. But if the price of this product is relatively low when compared to all other products purchased by this customer, the purchase will cause a change in product mix at the customer level and will display a negative impact to the change in revenue or margins.
Mix is typically nothing you can control and is very hard to manage proactively (if at all). However, it can increase the transparency on the impact some of your strategic decisions had on the mix and related impact on revenue/margin, e.g., to quantify the impact of a big global account that you acquired (or lost), or the impact on product mix driven by a new plant that you took into operation. Below are examples of various measurable “Mixes” that we seek to understand with margin bridge analysis:
Product Mix
Some products will have higher or lower margins than others. Some that have low margins can still be the most profitable product for a company if they’re sold in high numbers, while some of those with the highest margins will have a relatively small impact on overall profits. A margin impact analysis will help you understand how different product mixes will affect your overall profits. It can also give you valuable information that will help you formulate promotions involving different products to help you maximize profits.
Location Mix
Depending on the size of your company, you might have outlets in different locations. Each location might have a target audience with different needs and different buying behavior, and different sales methods to adapt to different behaviors and other variables. A margin analysis will help you identify how your locations are performing, and which other variables can affect the performance of each location. It will also help you identify which of the locations has the best sales methods that might also be effective in your other locations.
Sales Channel Mix
Any business is likely to have different sales channels that a margin analysis should consider. Even a boutique store might make sales from footfall and online orders. The same store might also attend events and even have a market stall to sell their goods. Regardless, each sales channel is likely to have different costs and other factors that will have an effect on your overall profits. Each channel is likely to have various impacts on your overall profit other than the margin each product is sold at. For example, the cost of renting a market stall might reduce margins, but it could also improve awareness of your products and brand, helping to increase profits overall. With a margin impact analysis, you will get a better understanding of how each channel affects your business.
Other mix effects such as Customer Mix, Sales Group Mix, and Currency Mix all work in similar ways, and have varying degrees of value depending on the customer and industry. But these mixes bely a gap that often exists in most PVM analysis – the ability to easily define your own Mix effect and apply it to your analysis, thus understanding its effect on your margins. If a variable exists and is captured at the transaction level (or can be extrapolated and applied to the dataset), then a custom Mix effect can be created. For example, we were recently approached by a wholesale distribution customer with 11 different methods for calculating freight and asked to help them measure the bottom-line impact of each of those different calculations. With some minor data work, in a matter of days, by using Vendavo’s Margin Bridge Analyzer we were able to define the custom Mix effect, and quickly ascertain which freight methodology should be used for different customers, product types, and distribution centers, as well as the methods that should be dropped altogether.
Examples of Margin Analysis
Margin analysis is widely used across various industries to gain insights into profitability and make informed business decisions. Here are some example models of margin analysis in action:
Retail Industry
A large clothing retailer conducted a gross margin analysis across its product lines. They discovered that accessories had a significantly higher gross margin (60%) compared to clothing items (40%). This insight led the company to allocate more floor space and marketing budget to accessories, resulting in a 15% increase in overall store profitability.
Technology Sector
A software company performed an operating margin analysis on its different service offerings. They found that their cloud-based solutions had a 30% operating margin, while their on-premise software had only a 15% margin. This analysis prompted the company to shift its focus towards cloud services, leading to improved overall profitability.
Manufacturing
An automobile manufacturer used contribution margin analysis to evaluate the profitability of different car models. They discovered that while their luxury models had a higher gross margin, their mid-range models contributed more to covering fixed costs due to higher sales volumes. This insight informed their production and marketing strategies.
E-commerce
An online retailer conducted a net margin analysis across different product categories and customer segments. They found that while electronics had a lower gross margin, the category had a higher net margin due to lower return rates and customer service costs. This led to a reallocation of resources to promote and optimize the electronics category.
Hospitality Industry
A hotel chain performed a margin analysis on its various services, including room bookings, restaurants, and spa treatments. They discovered that spa treatments had the highest margin (70%) but were underutilized. This led to increased marketing efforts for spa services, resulting in a 25% increase in overall hotel profitability.
Customize and Drill-Down Your Margin Analysis
The real value in these exercises comes from structuring it in different hierarchies for further “drill-downs”. For instance, reviewing product mix will always be beneficial, but its value improves dramatically when you can analyze that mix effect by industry, region, and customer, in any order that you choose. A high-level review starting and ending at the business unit-level will only bring so much value, as the granular impacts of your business strategy will still not be properly understood. Therefore, choosing which dimensions are used in your margin analysis and customizing the hierarchies have enormous benefits.
Summary
The causes of success or failure are multifaceted and often elusive. Businesses frequently know what happened, but rarely know why. Margin impact analysis helps you break down your profits into individual revenue streams to better understand what is driving increases or decreases in profits. This allows you to make more informed decisions about where to direct your resources. In order to do this effectively, ensure you recognize and isolate individual variables that make up margins. By analyzing gross margins, sales volumes, exchange rate, and repeat business effects, you’ll be able to identify where your pricing and sales strategies are performing well and where they need to be adjusted.
Vendavo offers a dedicated solution to analyzing Price, Volume, Mix performance called Vendavo Margin Bridge Analyzer. It is a powerful SaaS analytics solution enabling large B2B enterprises to understand the impacts on revenue and margin of factors like changes in prices, volumes sold, product mix, and other factors. It also gives large B2B organizations the ability to clearly simulate and quantify the lift or benefit of actions or initiatives like pricing on revenue and margin.
Vendavo Margin Bridge Analyzer not only enables Price/Volume/Mix analysis across different time periods like year-over-year, it also analyzes various datasets like plan vs. actuals. What’s more, you can compare analyses across product lines, sales organizations, and business units for greater insight. With critical, actionable insights into exactly what is driving changes to revenues and margins, your organization will be equipped to make more profitable decisions.
Key Takeaways
- Margin impact analysis helps break down profits into individual revenue streams to identify areas of focus
- Isolating individual variables that make up margins is crucial to understanding what is driving increases or decreases in profits
- Analyzing gross margins, sales volumes, exchange rates, and repeat business effects can provide businesses with actionable insights to adjust their pricing and sales strategies
- The relationship between price and volume is key to drawing the right conclusions about the performance of pricing and sales strategies
- By understanding the components of margin impact analysis, businesses can make informed decisions on where to direct their resources, and you can do this with Margin Bridge Analyzer