

Despite where you sit in the value chain, economic uncertainty and overall unpredictability has been the tough reality for chemical companies over the last few years. Most notably, feedstock prices have been hugely volatile. Add to that inflation and a war in Ukraine upsetting oil production and the road ahead looks to be no less bumpy of a ride.
If in this volatile climate you’re also still relying on multiple spreadsheets and data dumps to try and figure out what happened to your pricing and explain how that impacted profitability, you’re likely making little progress. And in chemicals, the old adage of ‘if you’re standing still you’re falling behind’ is especially true.
Improving margin starts with controlling your prices and this is possible even in unpredictable times. But where do you start? To get a better handle what is happening and what needs to change, try these 3 best practices:
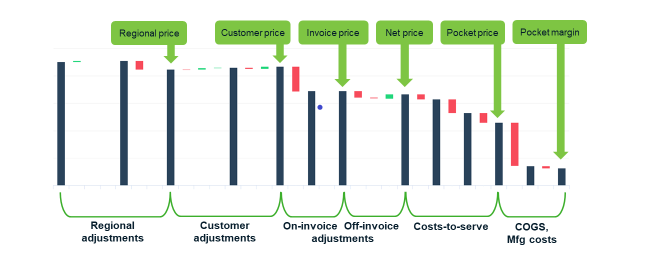
- Use Price Waterfalls: The first step in bringing structure to your pricing process is through a Price Waterfall. This tool will allow you to make fact-based, granular commercial decisions rather than relying on what you think is happening. Using data points from both your buy-side (such as feedstock prices) and sell side (costs-to-serve), you can identify specific profitability levers across all possible transactional adjustments from your starting price to your ending point, or margin. Make sure your waterfall allows you to capture deal-time decisions, so you can compare planned performance to actual performance. It will help you visualize further where to make future improvements.
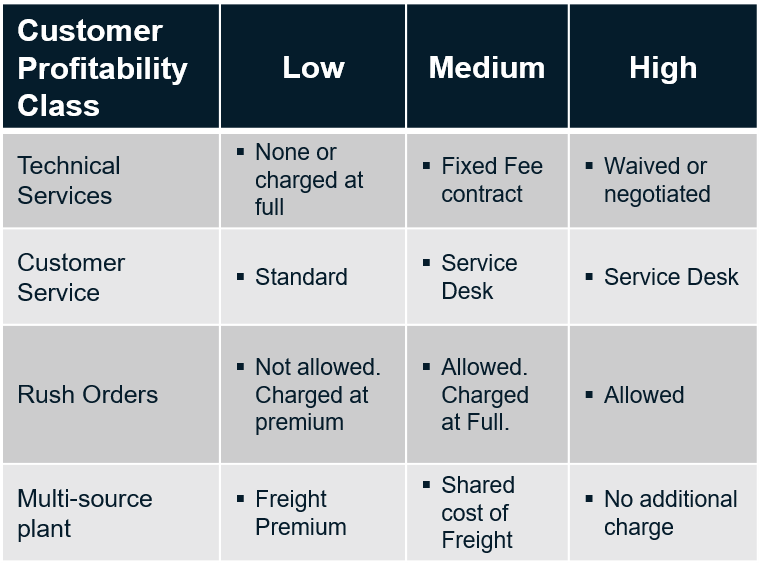
- Identify Costs-to-Serve and Set Policies by Customer Groups: Instead of relying on assumptions and rolled-up reporting, get clear on what is really happening where. A properly designed waterfall will have appropriate buckets to help you measure, track and manage costs-to-serve as distinct waterfall elements. Each key cost-to-serve element, such as freight for example, should have a corresponding recovery charge. When looking at Planned vs. Actual, metrics should be able to hold “deal-time” views of charges and costs, and compare both to charges and costs actually executed. Set costs-to-serve policies by customer classification.
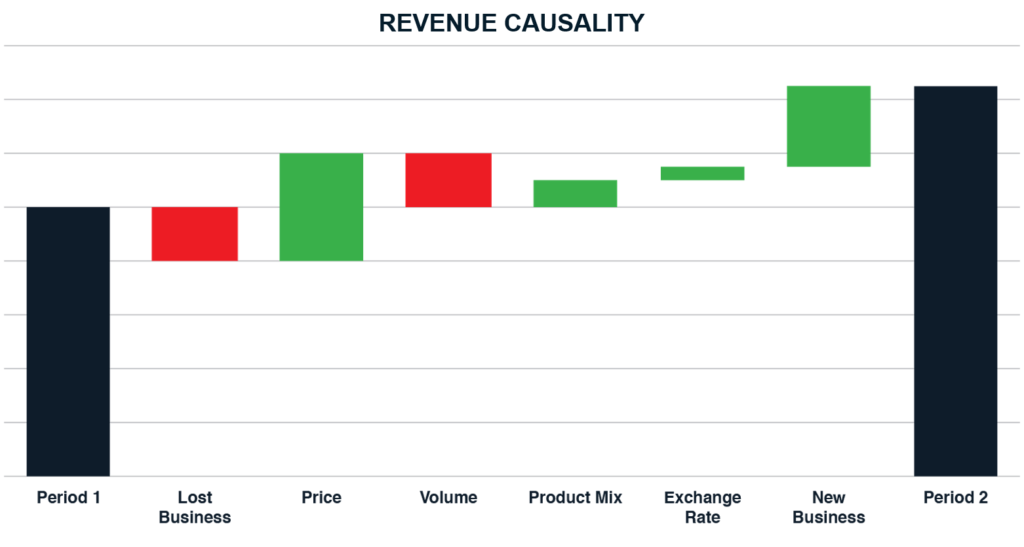
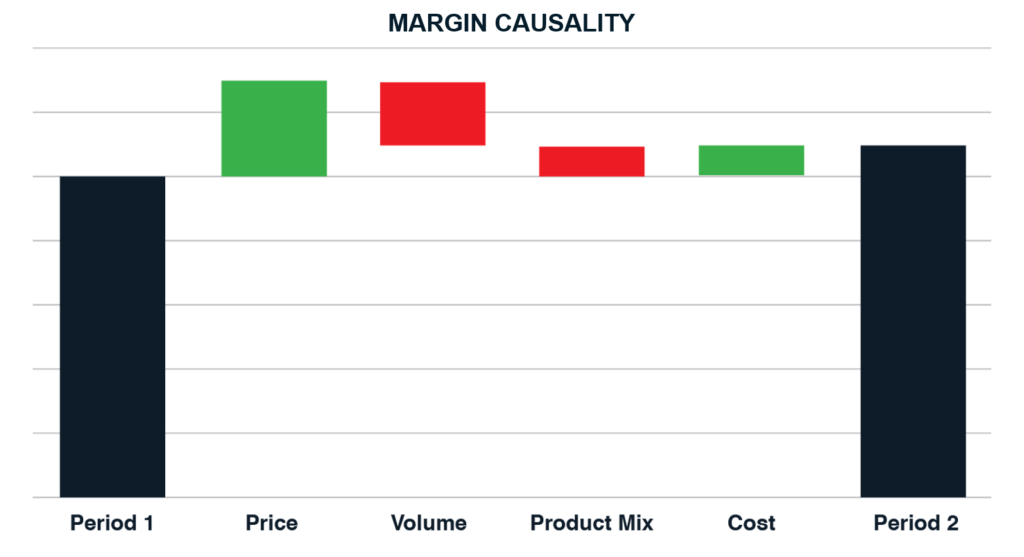
- Standardize Price-Volume-Mix Assessment: Price increases are difficult to measure and track but identifying causality is critical to long-term growth. What do the changes over time look like and why? With this methodology, you can easily communicate upwards when a simple concise explanation is required and, at the same time, be confident that you can drill down into the details to provide more specifics as those questions arise. In some cases, you might consider the addition of foreign exchange rates, or business won/lost to have a slightly broader set of causes. In industries where costs make for tentative profitability, consider including a cost bucket and make your PVM assessment on a margin basis.
To learn more about top strategies for controlling price and improving margin in the chemicals industry we’re here to help.