

In this article by Business Consultant, Israel Rodrigo, discover the importance of volume curves and how you can optimize them for your business needs.
In my prior article on volume discounts, we illustrated the ways companies can architect their commercial strategies, so they can incentivize customers’ buying behaviors.
Many companies spend most of their time and effort in the planning stage, discussing and designing pricing strategy. Often, less is done around the actual pricing execution and effective price realization. The most adaptive pricing organizations, will spend most of their time on techniques that quantify the value against next alternative options.
There are many ways to deliver value by designing pricing mechanisms (subscriptions, monetization of cheap equipment vs their more expensive consumables, freemium, etc) but these mechanisms only work if they are supported with advanced segmentation based on customer behavior and a dynamic pricing execution framework.
In order to capture value at scale, organizations need a robust pricing execution framework that couples pricing discipline governance with advanced technological capabilities.The same concept applies to volume discount commercial policies.
What are Price Volume Curves?
Volume-based discount curves, or tiered-pricing policies, were developed to optimize sales and margin opportunities, balancing price realization and risk between the buyer and the seller.
The idea is simple: if a customer buys more volume, we can discount the product or services further and incentivize the purchase of more units.
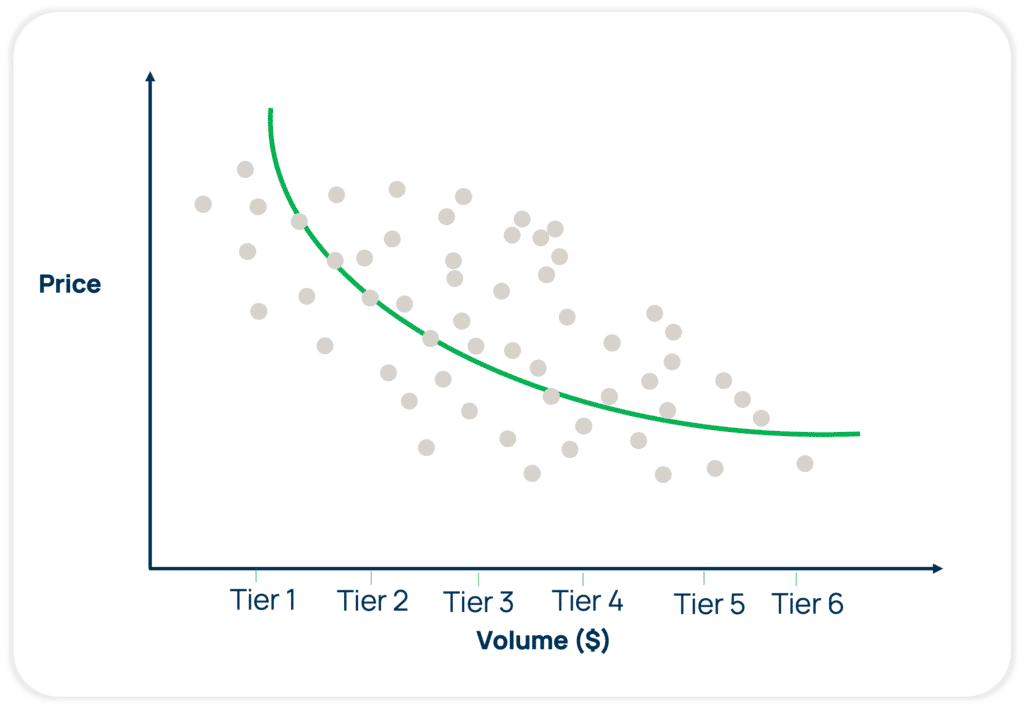
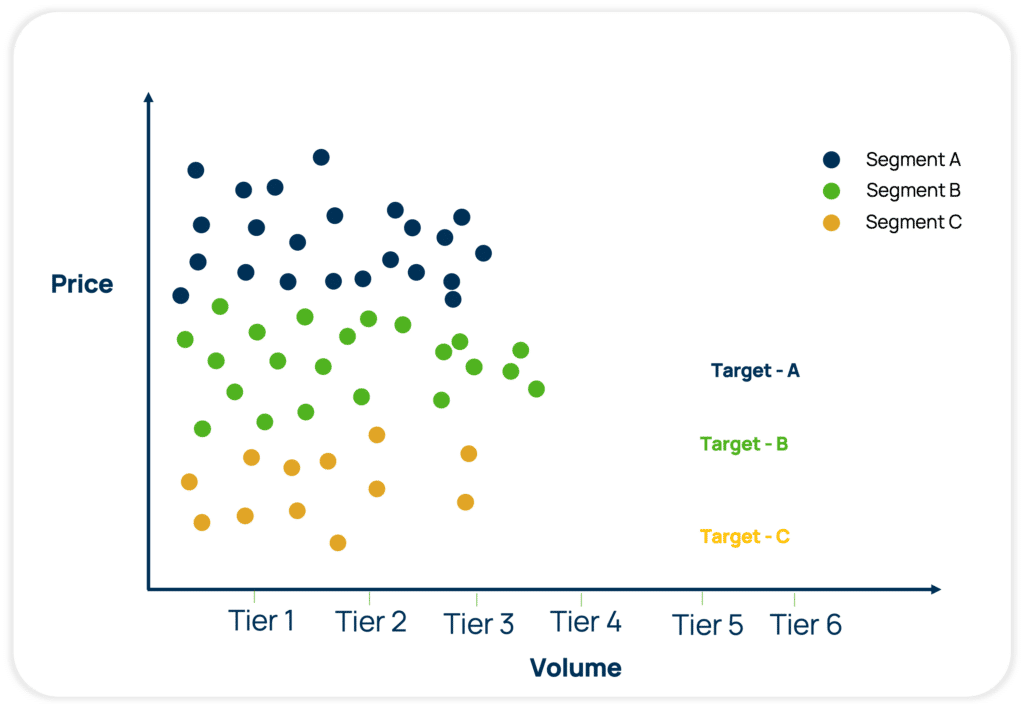
Your company likely has a standard set of price curves with “volume breaks or tiers” which may have some resemblance to the image below.
What is the Goal of Policy Optimization?
The goal of policy optimization is to support and improve target pricing in environments where certain pricing policies play a critical role. These situations are typically centered around volume pricing – by quantity annual volume commitment, or customer size – SKU premiums, or attribute pricing. Price volume discount curves are an example of policy optimization.
Conceptually, by properly utilizing and monitoring volume curves, businesses with an array of product lines and customer buying levels, can optimize their pricing to better fit their situation.
The Challenges of Price Curve Optimization
Lacking well-defined volume pricing policies
Many high-tech companies lack well-defined volume pricing policies, leaving volume discounts at the discretion of sales. These policies are often poorly defined and infrequently reviewed, leading to a dangerous discounting death spiral. Relying solely on historical sales transactions for policy formulation can perpetuate past discounting mistakes into the future. This may result in sales staff being driven by conflicting incentives, offering high discounts or gravitating towards lower-priced products due to a lack of market/product knowledge. To avoid this, pricers should consider historical sales data as one input, while keeping the option to adjust or auto-generate policies through price curve optimization based on actual or desired outcomes.
Segmentation has its limits
Segmentation in estimating volume pricing behavior has its limitations. Bad historical behavior tends to repeat itself, hindering accurate predictions. Additionally, segmentation size can become unmanageable, leading to inefficiencies. Volume tiers may also fail to extrapolate accurately when deal order sizes deviate from past patterns.
How Can Manufacturers and Distributors Make Volume-Discount Pricing Improvements?
While some companies have well-defined volume price/discount curves and policies in place, others have crudely defined and infrequently reviewed policies. Improvements can be made by adopting a Smart Pricing approach that combines data-based segmentation and pricing optimization.
This approach will help you create meaningful pricing guidance for sales teams, ultimately adding revenue to your bottom line.
Margins increase when volume discounts are not considered in the negotiation process. Negotiated discounts have a more implicit customer willingness to pay for your products whereas a volume-based discount aims to incentivize purchasing patterns and larger quantity orders.

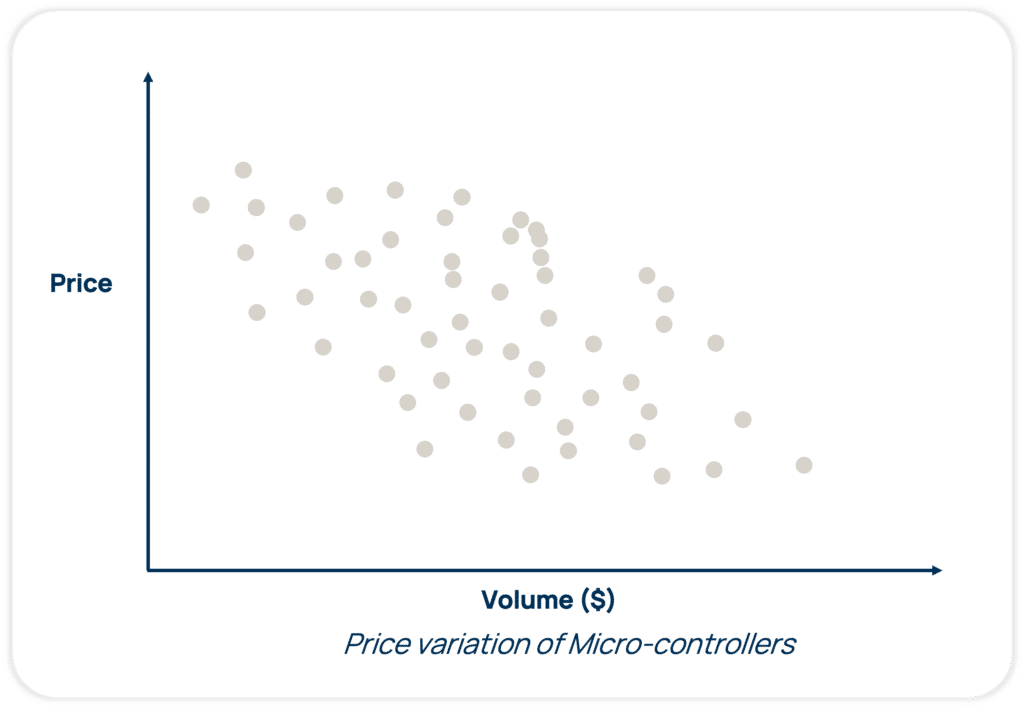
The figure above shows that customers’ willingness to pay for the same product varies, irrespective of the order size.
To achieve this result, we isolate the impact of volume discounting from the segmentation and price optimization model before integrating them into CPQ or CRM systems.
By breaking down tiered discounts and customer willingness to pay separately, we can customize commercial policies effectively and maximize value capture.
Understanding Volume Discounts and Their Impact on Segmentation
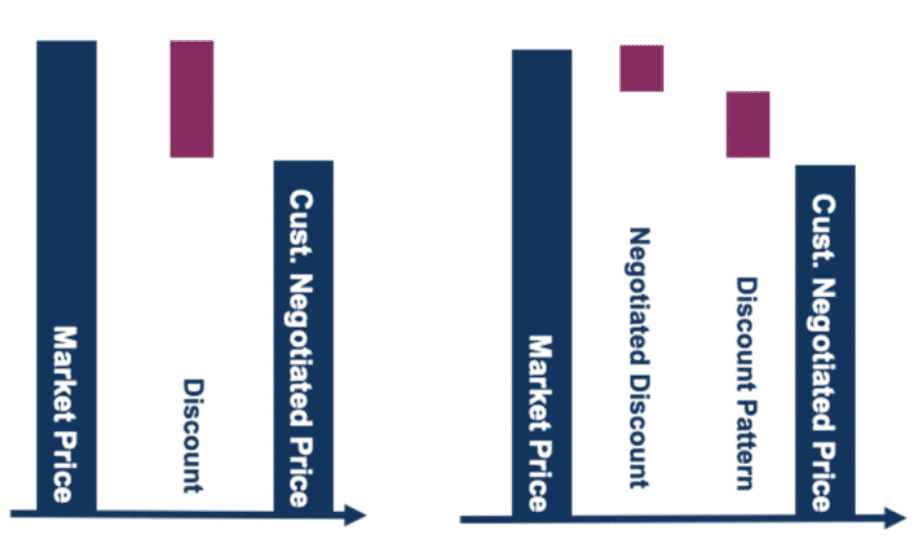
Negotiated Discount = Total Discount – Volume Discount
Understanding your volume discount and its impact on segmentation is vital for long-term success. By isolating the volume-defined discount element from the total discount, segmentation based on Willingness-to-Pay can be established using the negotiated discount element:
Total Discount = Policy Discount + Negotiated Discount
This approach involves considering two categories, with sales focusing their discounting efforts on the negotiated discounts. In the example below, we are normalizing the total discount for the volume-related discount effect. This allows us to accurately measure and assess customer willingness to pay once the volume discount dependency is eliminated.
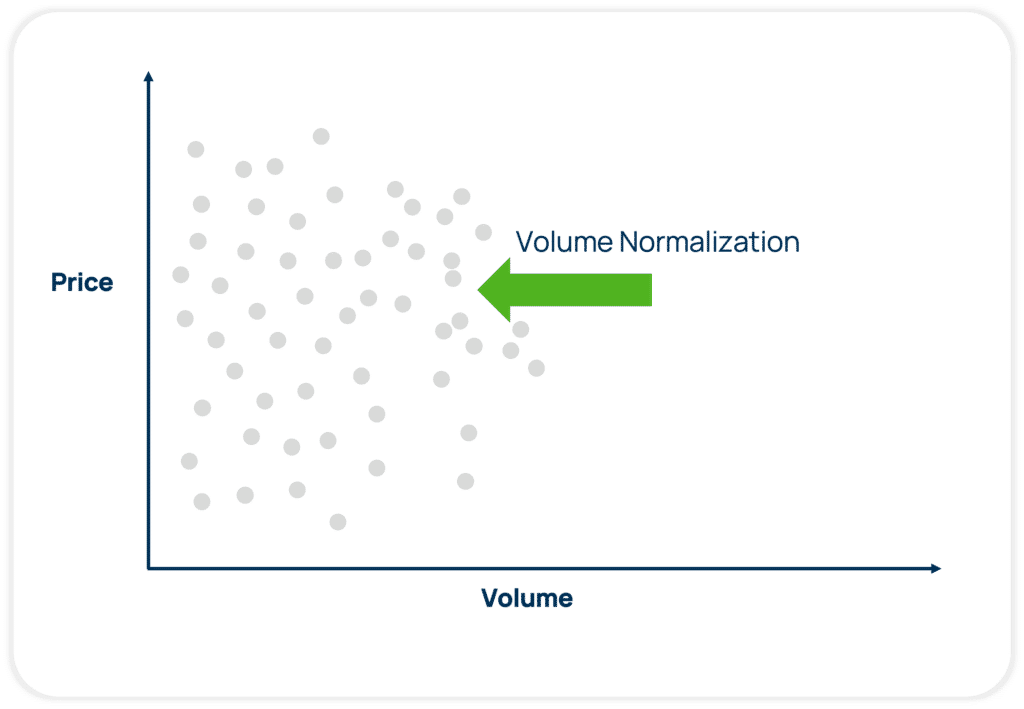
Ignoring volume effects with discounts and margin leads to an invalid comparison of offered discounts. It is apples to oranges. Considering volume effects from the beginning results in improved segmentation, leading to better pricing guidance. This, in turn, translates to increased sales opportunities and higher profit margins.
How Technology Supports and Optimizes Volume-Based Discounting Policies
Volume curve optimization plays a crucial role in pricing and require separate management for consistency and pricing clarity.
The volume curve policy serves as the foundation for an intelligent decision support system, empowering users to apply more realistic negotiated discounts. It’s essential to distinguish between the list price at volume (driven by policy) and the negotiated discount.
Smart pricing enables companies to set prices scientifically, utilizing statistical, data-driven segmentation. By grouping transactions based on similar willingness to pay, considering relevant categories of customers and products, an optimized target price range can be determined.
How Do Volume Curve Discounts Determine Sales Negotiations?
In pricing segmentation, volume curve discounts play a vital role in determining sales negotiations.
With AI-enabled pricing segmentation, companies can create more precise pricing guidance, catering to specific customers’ willingness-to-pay. This empowers sales teams with immediate access to floors, target, and stretch prices for approval.
How Can Price Optimization Solutions Enhance Volume Policies?
Leading price optimization solutions, powered by advanced algorithmic models, AI, and process automation, help define and continuously refine segmentation models. Establishing logical price/volume positioning through volume clusters (tiers) is a prerequisite for price curve and volume optimization modeling. At Vendavo, our Price optimization solution adds statistical rigor to derive volume policies while offering customers flexibility to fine-tune or override these policies based on business insights.
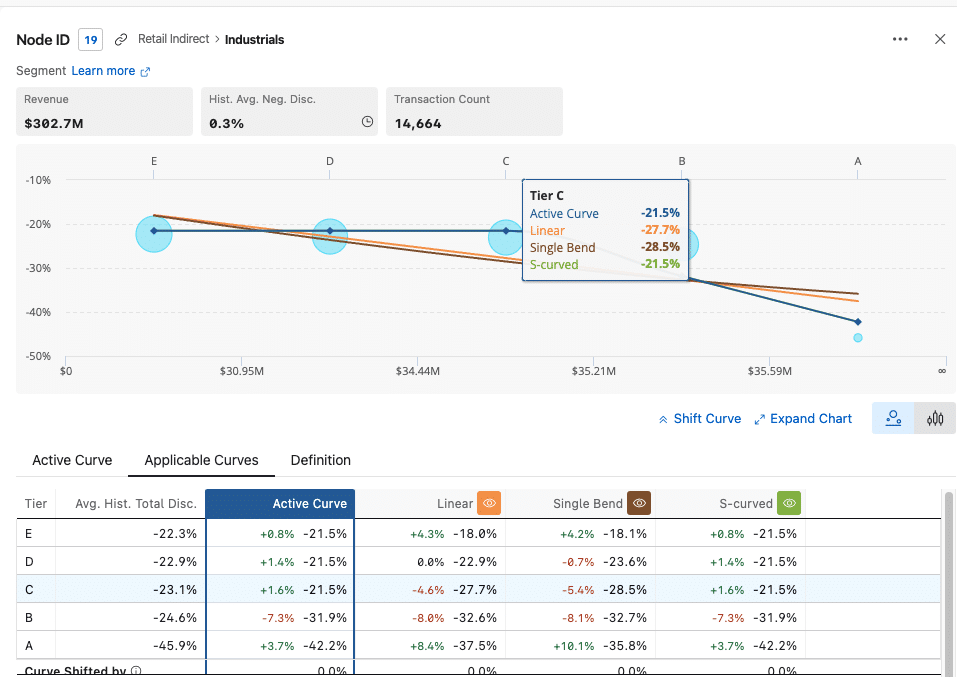
By accounting for volume separately, pricing managers, analysts, and teams can provide enhanced price guidance for Sales, considering both willingness to pay and volume. Below is an example of a volume/tier price curve optimization.
Lessons Learned from Successful Volume-Curve Optimization Policies
Next, we’ll provide an example of a hybrid clustering-based algorithm that cleverly merges statistics with business intelligence to effectively derive volume clusters.
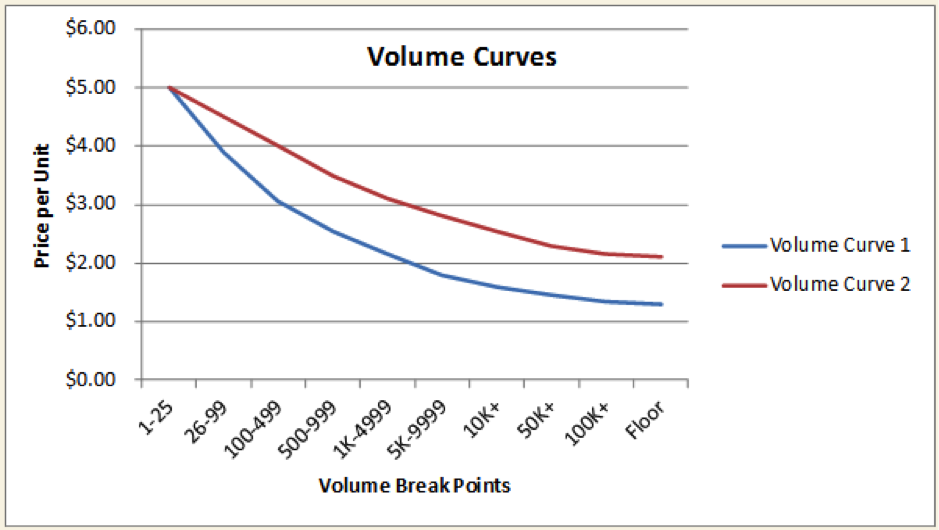
The figure above illustrates two price curves, representing either different product lines or the same product line under normal or competitive/aggressive business scenarios. The accompanying table displays internal policies corresponding to various volume break points.

The table above shows three sets of break points: 1-25, 26-99, and 100-499, catering to low volume customers accessing the company’s website. The next set includes break points from 500-999, 1K-4999, and 5K-9999, designed to incentivize additional volume purchases through partner portals. The final set (10K+ and above) operates in a negotiated B2B environment, incorporating various factors for a custom discount on top of the volume policy discount.
In my experience working with customers across different industries, I’ve observed variations in curve designs. Some opt for simplicity, using only a few volume curves for their entire product line, while others create unique curves for each product line or parent family, resulting in multiple maintenance tasks. Some companies find a middle ground, balancing simplicity and complexity.
When creating and implementing volume curves, several factors come into play. Notably, two crucial aspects to consider are:
- Evaluate your volume curves periodically to make sure the intended purpose is served
- Distinguish between the volume curve discount (list price at volume) and negotiated discount
Evaluate and Optimize Price Volume Curves Periodically
Things change, so you must be prepared for any scenario. Let’s look at two simplified examples where the price volume curves may need to be adjusted and optimized periodically. But first, some important definitions:
- Data: Actual recognized revenue against each volume tier and corresponding discount from the list price or some common reference price
- Current Policy: Current volume discount policy based on volume breaks
- Approved Policy: The result of user reviewed and implemented discount (can include volume discount and negotiated discount in some cases)
- Proposed Policy: The result of optimization algorithm (statistical analysis) recommending where the volume discount policy should reside
Example 1. Decreased Discounts from the Current Policy in Place
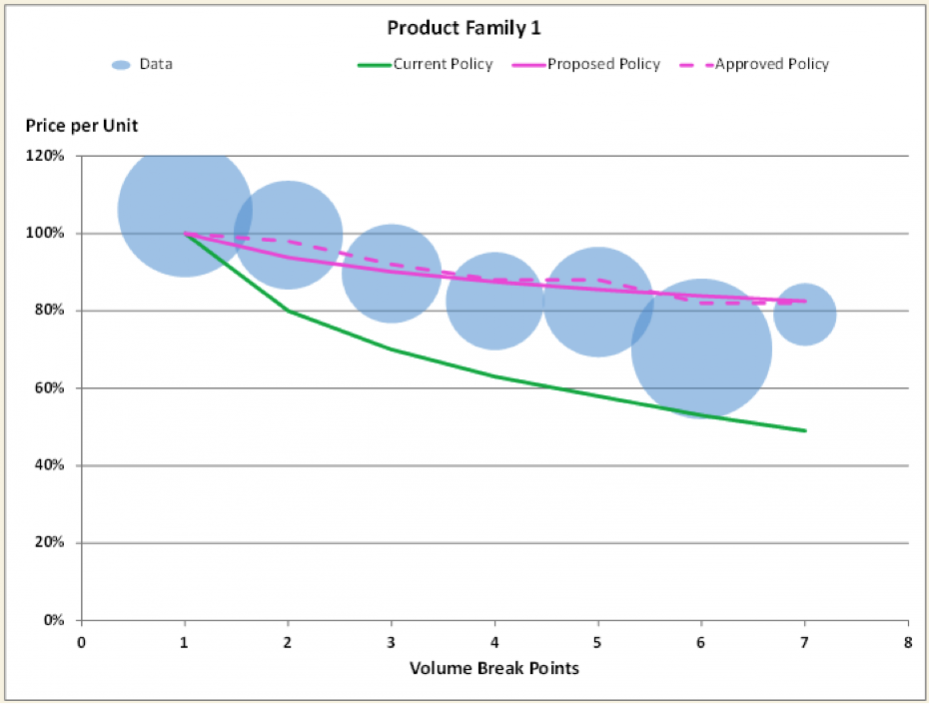
Example 1 demonstrates a scenario where the current policy grants volume discounts at a steep rate. However, the approved policy, derived from transaction data, indicates the need to decrease these discounts. Statistical analysis can help recommend the optimal slope for the proposed policy curve. This analysis is relevant for specific product subsets or when evaluating and refining outdated policies due to changing market and business conditions.
Example 2. Increased Discounts from the Current Policy in Place
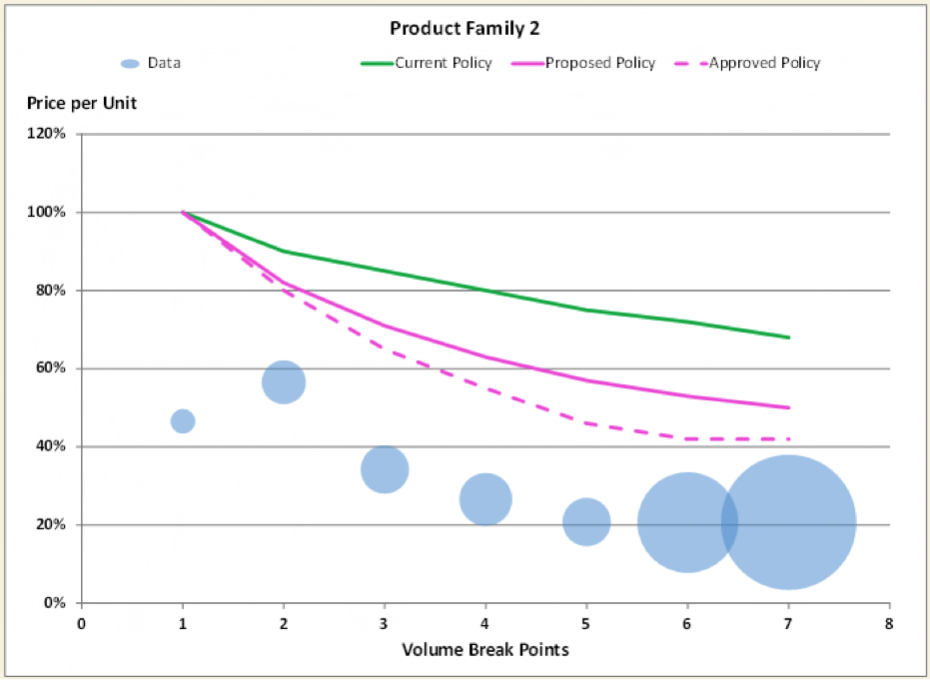
In Example 2, a different product family has a current policy with standard volume discounts. However, the approved policy, based on transaction data, indicates the need to increase these discounts to align with competitive market conditions. Statistical analysis helps determine the optimal slope for the proposed policy curve, providing flexibility to apply negotiated discounts for each customer deal.
Distinguish Between the Volume Curve Discount and Negotiated Discount
When implementing volume-based discount policies, it’s crucial to distinguish between the volume curve discount and the negotiated discount. By understanding these components, you can optimize your pricing strategies effectively.
Negotiated Price = List Price @ Volume + Negotiated Discount
In summary, here are three key areas to keep on mind for a successful execution of volume based discount policies.
1. Customer and Product Segmentation
Effective customer and product segmentation enables value-based pricing strategies, incorporating differentiation based on product tiers (good, better, best) and customer value contributions (high, medium, low). Implementing price-volume discount recommendation envelopes provides valuable insights into price sensitivity and profitability at the segment level.
2. Dynamic Execution
The ability to swiftly respond to market dynamics, such as cost changes and competitor moves, is crucial for successful volume-based discount policies. Implementing a governance framework ensures control while adjusting pricing decisions in accordance with industry dynamics, irrespective of company maturity.
3. Aligned Sales Incentives
Sales incentives should be linked to business value and customer compliance. Standardizing discount levels and tiers within a clear governance process helps manage escalations and exceptions. Aligning incentives with market share and success metrics across different channels drives optimal pricing and sales effectiveness, resulting in acquiring the right customers at the right price.